

Women, Caucasians, being immunized for COVID-19 at higher rates than other groups
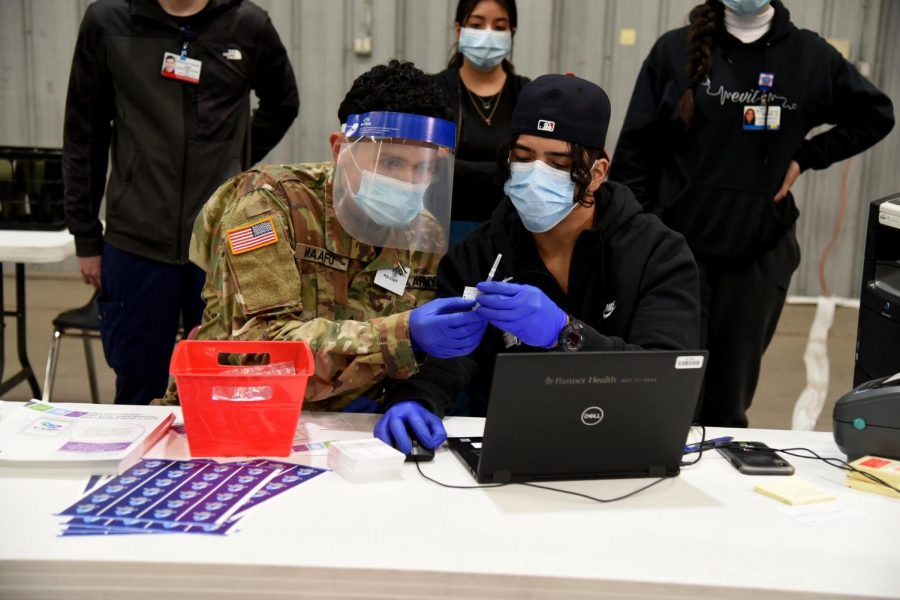
Arizona National Guard
February 23, 2021
As COVID-19 vaccinations continue, county officials continue to be concerned over ethnic communities being underserved.
Nationally, The Centers for Disease Control and Prevention (CDC) data charts show that out of the total number of individuals who completed the two dose process, 65.6% where White, 13.7% were Other, 8% Hispanic, 5.8% Black, 5% Asian, 1.7% American Indian/Alaska Native and .3% Native Hawaiian or other Pacific Islander.
Each state has different racial and ethnic demographics and while each county is at different vaccination phases, the Latino community in Arizona shows low engagement numbers and county officials say efforts like providing translators and access to Wi-Fi or facilitating transportation for those without cars are among the efforts, according to AzCentral.
In Maricopa county, over 15% of all adult residents have been vaccinated with at least one dose. Of those vaccinated at time of publishing, 66.5% are white, 5.7% are Hispanic/Latino, 2.2% American Indian or Alaska Native, 4.1% Asian, 2.2% are Black and 19.3% remaining listed their race as Other or unknown.
Also, according to the CDC COVID Tracker and the Maricopa County COVID-19 vaccine data, women are being vaccinated more than men, accounting for about 60% of those vaccinated so far.